Le Chonk AI PDF, chart & image understanding exercises
Keep the source beside the answer, and verify each claim.
Inputs you can inspect
Use the synthetic operations note PDF, its plain-text equivalent, and quarterly chart. No real company data is used. Download the chart’s reference values.
Case 1: PDF question with evidence
From the operations note, give the approved delivery date and owner. Cite the page and paragraph IDs. Is the budget approved? If the document does not say, answer “not stated”.| Question | Authored reference answer | Evidence |
|---|---|---|
| Delivery date | October 12, 2026 | Page 1, P2 |
| Owner | Dana Ruiz | Page 1, P3 |
| Budget approved? | Not stated | No approval appears in P1–P4 |
Prepare the same PDF identically for every model: either extract text with paragraph IDs or rasterize each page at a fixed resolution. A PDF file is not a raw image content part; verify the provider’s file pipeline before upload.
Case 2: chart extraction
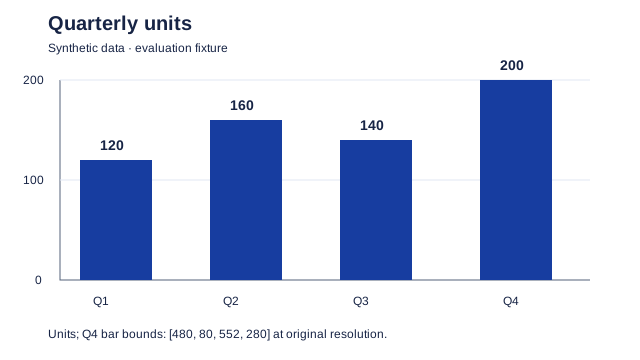
List every quarter and its units from the chart. Compute Q1-to-Q4 percentage growth. Keep raw chart values separate from your calculation and show the arithmetic.| Quarter | Reference units |
|---|---|
| Q1 | 120 |
| Q2 | 160 |
| Q3 | 140 |
| Q4 | 200 |
Reference arithmetic: (200 − 120) / 120 × 100 = 66.666…%, about 66.7%. Verify axis units and labels. A valid JSON table can still contain swapped quarters or invented values.
Case 3: image grounding
On the same 640×360 chart, locate the Q4 blue bar. Return [left, top, right, bottom] pixel coordinates with origin at the top-left. Explain whether your coordinates refer to the bar or its label.Authored reference bar box: [480, 80, 552, 280]. Use a ±4-pixel tolerance after rasterizing the SVG at exactly 640×360. Score the bar and label distinction separately. Do not score coordinates from a resized image as if it had the original dimensions.
Input limits and cost
The independent launch report describes support for up to 100 images per request. This is a dated third-party observation; check current API/account limits. Artificial Analysis launch evaluation. Document preprocessing, image tokens, OCR and repeated pages can change cost.
- Convert the chart to a supported image encoding before API image input; SVG is the inspectable source fixture, not a promised accepted image format.
- Preserve page numbers when extracting text. Small text, rotated pages and dense tables can impair recognition.
- Record billed input and output, image preprocessing and any OCR charges. No task cost or latency has been measured here.
- Look for misplaced citations, missed negation, unit confusion and false certainty on unreadable text.
| Evidence | Current status |
|---|---|
| Model output / patch | Not available: model exercise not run |
| Tool trace / human edits | Not recorded |
| Latency / usage / task cost | Not measured |
| Reference expectations | Authored and inspectable; not model output |
Sources & verification
Research snapshot: . Source statements are dated; API access and prices can change.
- Mistral Large 4 model documentation
- Mistral Chat Completion API
- Artificial Analysis launch evaluation
- Mistral release announcement
Original model runs are marked “not run” unless a trace is provided. Read our editorial method.